
The population of Preston increased by 1% between 2013 and 2018, according to the latest available figures from the Office of National Statistics (ONS).
South Ribble saw similar population growth with an increase of 1.57% between 2014 and 2019.
While Chorley has seen the biggest population rise since 2014, with a 5.92% increase.
But some Preston, Chorley and South Ribble wards have seen the population explode over the last five years of available data.
These are the 10 Preston, Chorley and South Ribble areas where the population increased by more than 10% over five years (Images are for illustration purposes only):
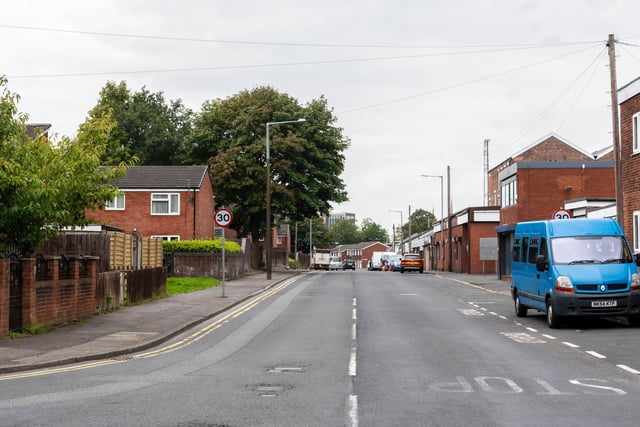
1. St George's - Preston
The population of St George's in Preston increased by 10.15% from 2013 to 2018. The average growth in the city was 1%.
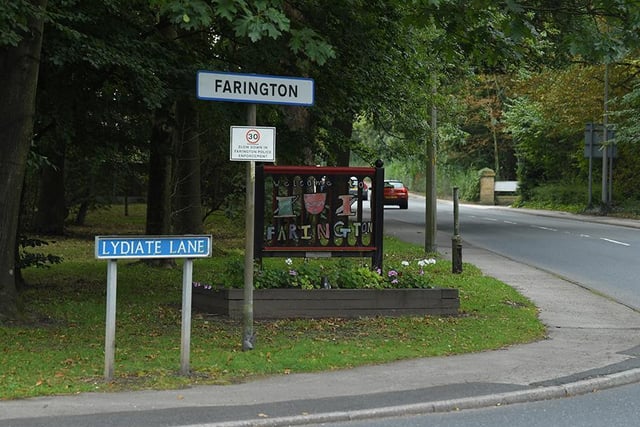
2. Farington West - South Ribble
The population of Farington West in South Ribble increased by 10.17% from 2014 to 2019. The average growth in the area was 1.57%.
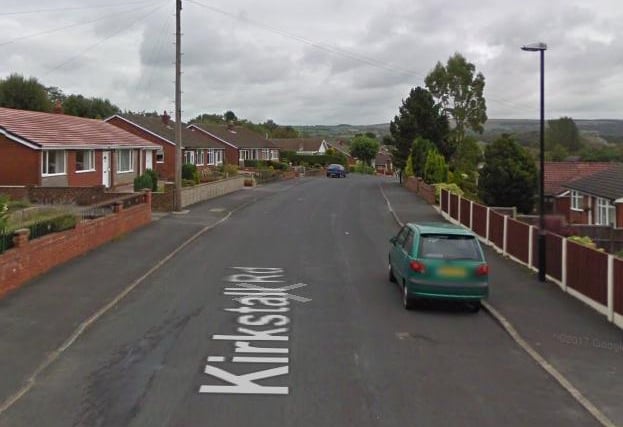
3. Chorley South East - Chorley
The population of Chorley South East increased by 10.26% from 2014 to 2019. The average growth in the area was 5.92%. Photo: Google
4. Buckshaw & Worden - South Ribble
The population of Buckshaw & Worden in South Ribble increased by 10.71% from 2014 to 2019. The average growth in the area was 1.57%.